 |
Hennepin County |
U.S. Census 2000, Tables, Maps, and Charts Counting Persons by Race and Hennepin County School Districts and Minneapolis Neighborhoods. Hispanic and Latino ethnicity is counted separately from race (click to Hispanics/Latinos).
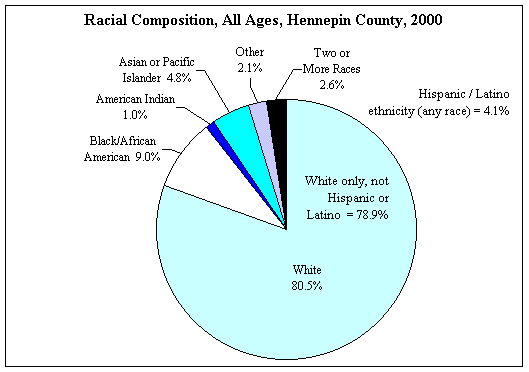
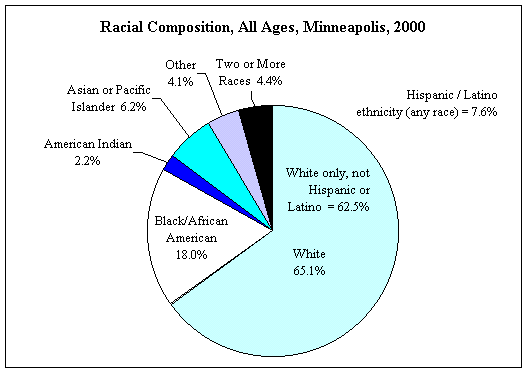
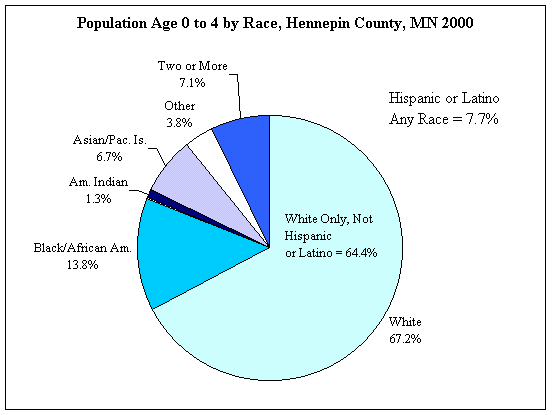
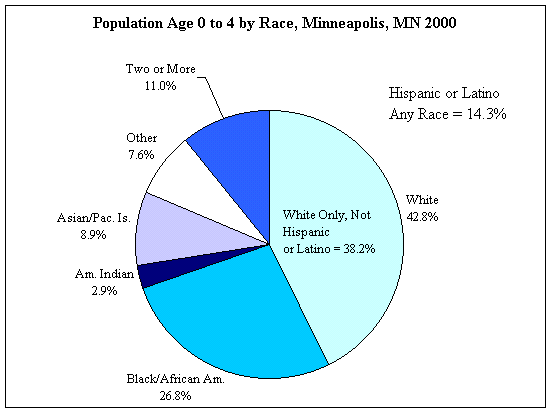
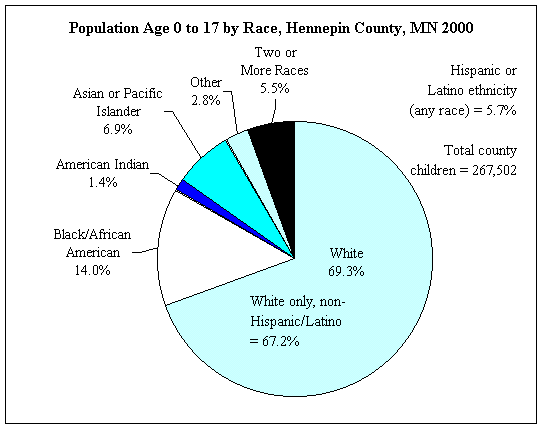
The 2000 Census was the first time that people could choose more than one race, and the data on this page categorize those persons who only chose one race to identify themselves. All those who chose two or more are grouped into their own distinct category.
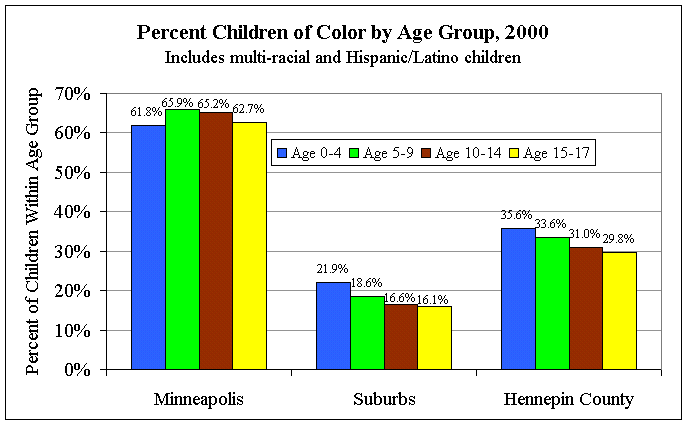
Bar chart of children of color by age group, Hennepin County, suburbs, and Minneapolis, 2000
Table of percent of population by total races tallied, Minneapolis neighborhoods, 2000
Table of Children by Race and Poverty Status, Hennepin and Minneapolis Totals, 1999 *NEW
Map of children of color age 0-17, Eastern Hennepin County, 2000
Map of elderly of color age 65 and older, Eastern Hennepin County, 2000
Downloadable Excel spreadsheets with more detailed data on racial composition
Only those who chose one race comprise the percentages for individual races.
Source: U.S. Census 2000, Public Law 94-171 and Summary File 1; Produced by Hennepin County Children, Families and Adults, September 25, 2001
Source: U.S. Census 2000, Public Law 94-171 and Summary File 1; Produced by Hennepin County Children, Families and Adults,
September 25, 2001
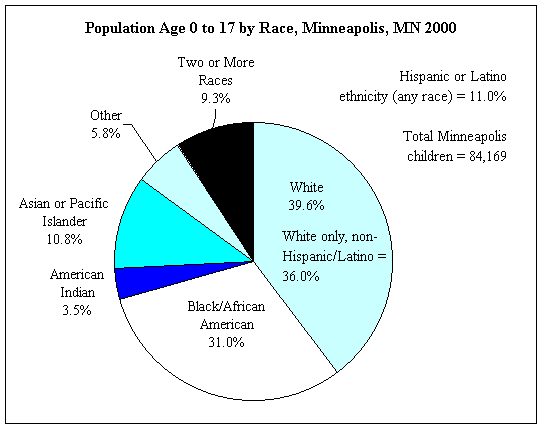
Source: U.S. Census 2000, Public Law 94-171 and Summary File 1; Produced by Hennepin County Children, Families and Adults, December 12, 2001